Every quality signal, in one view
In cell and gene therapy, every dataset matters. Insights turns your data into clear, trusted dashboards that help teams act faster, stay compliant, and improve outcomes.
See what is open and overdue
Find where work stalls
Report up in a click
Ready-made dashboards
from day one
Seven dashboards built on Smart-QMS data cover the questions quality teams ask most, and each one can be tailored to your organization.
01
Executive quality
Open and overdue CAPAs, training compliance, and quality events by type, month, and department.
02
CAPA
On-track, approaching, and overdue CAPAs, completion rates, and how long each spends in every workflow step.
03
Deviation
The same view for deviations: what is open, what is late, and where it is waiting.
04
Learning management
Completed, incomplete, overdue, and exempted training by department, location, or person, with a completion forecast.
05
Document control
Average days in each document status, on-time approvals, frequently revised documents, and overdue periodic reviews.
06
Cross-module connections
Follow quality events from site to department to the linked complaints, non-conformances, and CAPAs.
07
Tasks and workload
Open and overdue tasks by department and owner, with completion rates for each task type.
Build your own
Copy any dashboard, add or remove widgets, or create new ones from the widget library.
Answers to the questions you ask every week
Each dashboard is built from widgets you can filter by department, location, or person, and drill into for detail.
Which CAPAs are at risk?
Where does work stall?
Are events trending up?
Who is behind on training?
Which documents keep changing?
Are periodic reviews on time?
See exactly where CAPAs get stuck
Open counts tell you there is a backlog. Insights shows you why, by measuring how long each event spends in every workflow step, department by department.
Days in stage by department
How events connect
Ownership made visible
Illustrative example
Illustrative example
See training compliance before the deadline
Insights forecasts training completion for the months ahead from your completion history, so you can step in before an inspection, not after it.
Completion trends and forecasts
Every training status
Time to complete
Solutions Overview
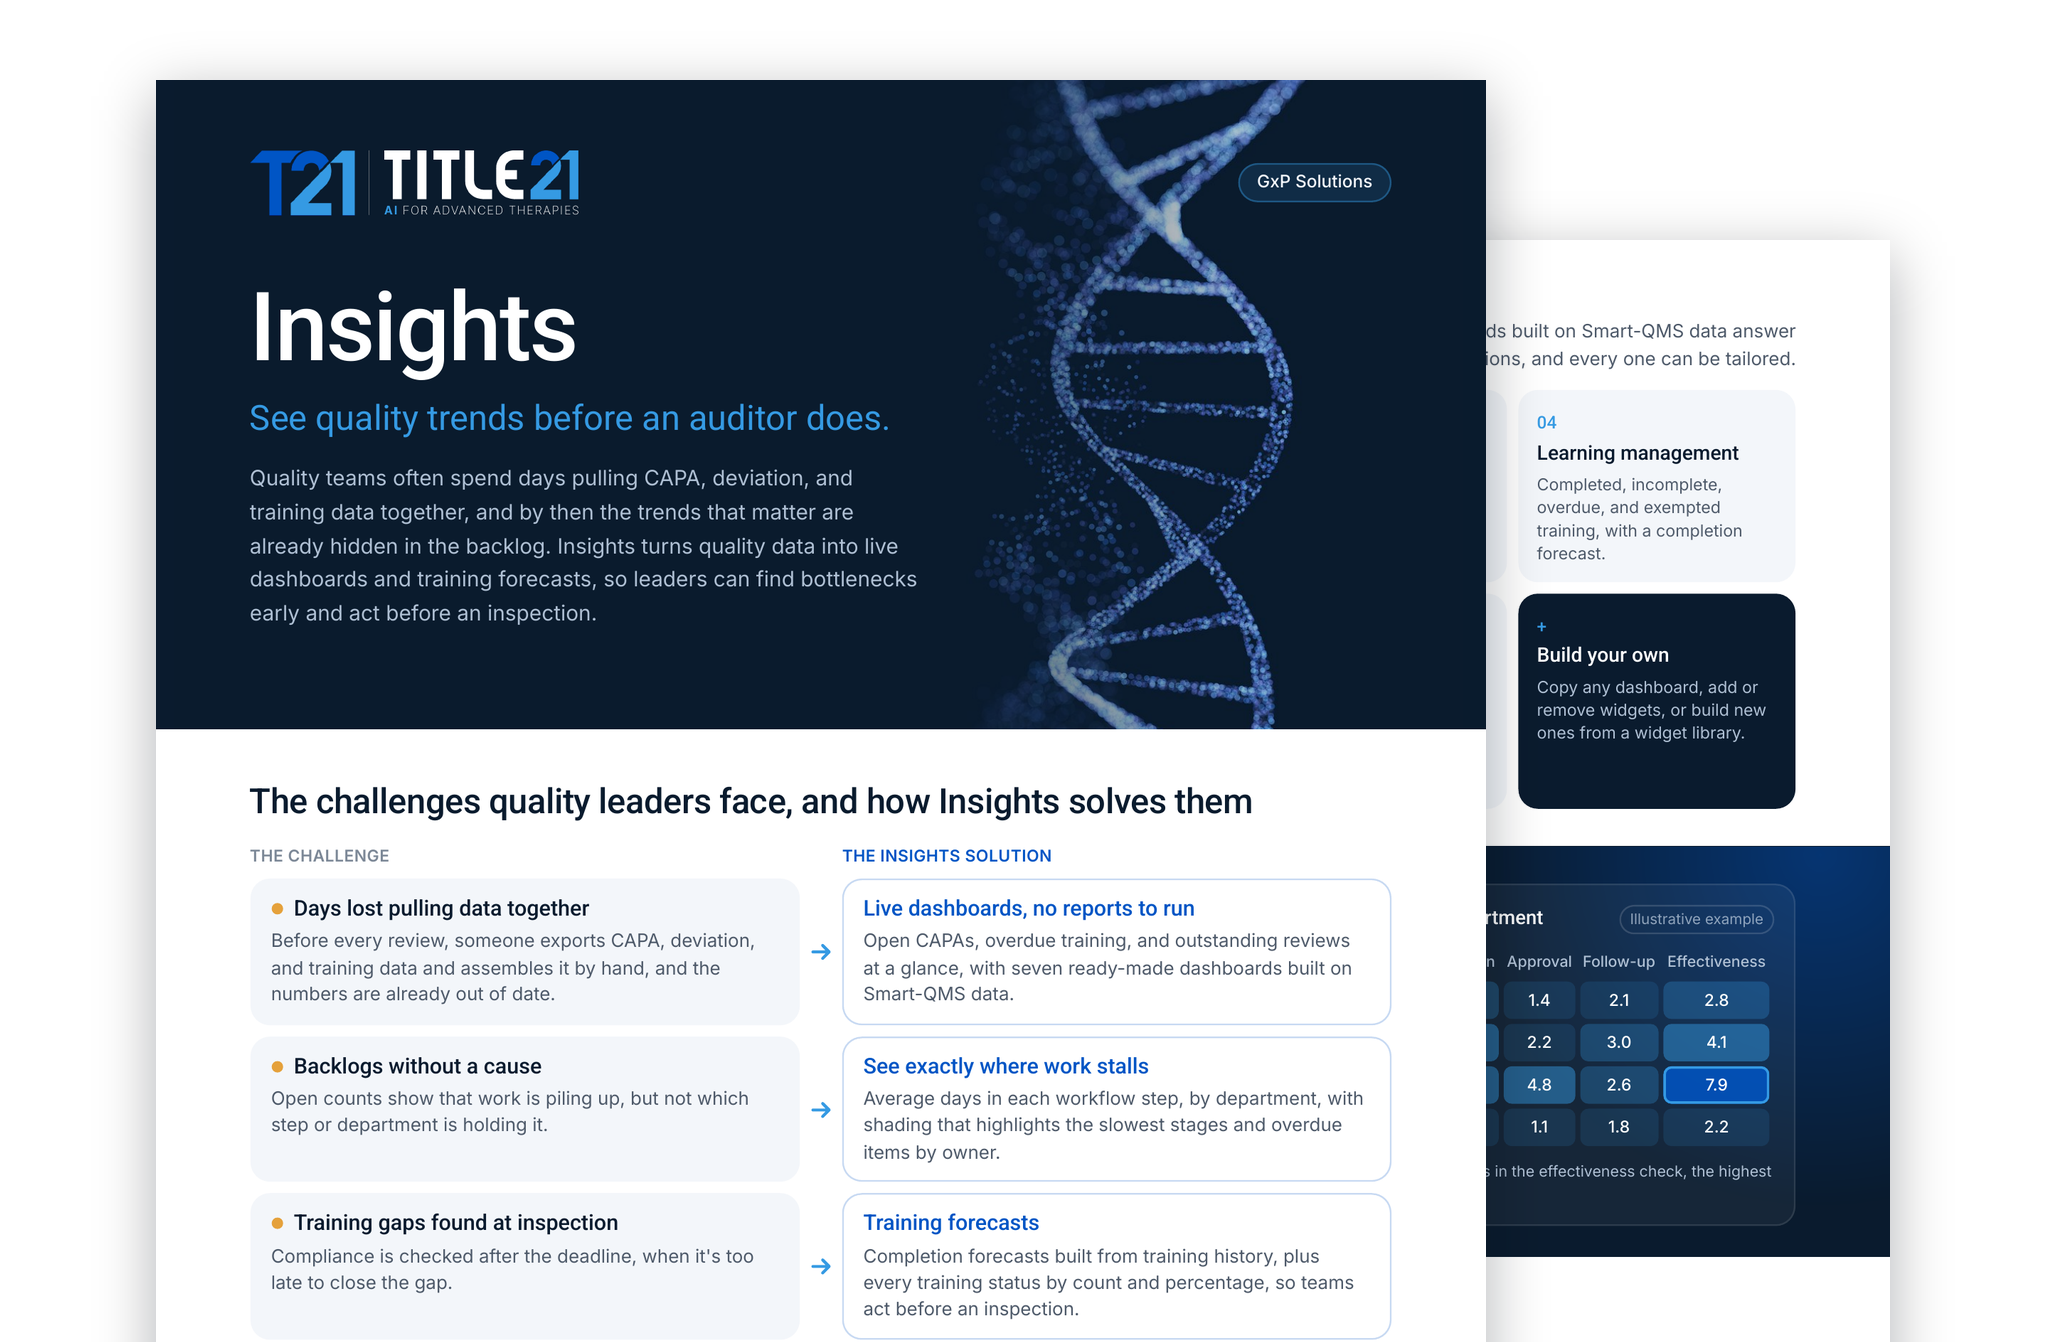
Insights at a glance
Download our two-page guide to Insights dashboards and the quality questions they answer.
Complete the form to download.
See your quality data come to life.
Bring the question your leadership asks every month. We will show you the dashboard that answers it.